Toronto presentation Siljander
•Download as PPTX, PDF•
0 likes•288 views

Toronto IHEA conference 2011 presentation.

Recommended
Recommended
More Related Content
What's hot
What's hot (18)
Viewers also liked
Viewers also liked (20)
Similar to Toronto presentation Siljander
Similar to Toronto presentation Siljander (20)
More from Eero Siljander
More from Eero Siljander (20)
Recently uploaded
Recently uploaded (20)
Toronto presentation Siljander
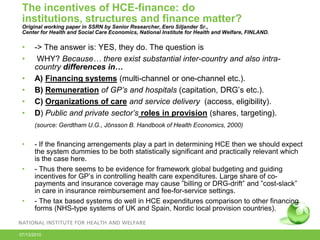
- 1. The incentives of HCE-finance: do institutions, structures and finance matter? Original working paper in SSRN by Senior Researcher, Eero Siljander Sr., Center for Health and Social Care Economics, National Institute for Health and Welfare, FINLAND. • • • • • • -> The answer is: YES, they do. The question is WHY? Because… there exist substantial inter-country and also intracountry differences in… A) Financing systems (multi-channel or one-channel etc.). B) Remuneration of GP’s and hospitals (capitation, DRG’s etc.). C) Organizations of care and service delivery (access, eligibility). D) Public and private sector’s roles in provision (shares, targeting). (source: Gerdtham U.G., Jönsson B. Handbook of Health Economics, 2000) • • • - If the financing arrengements play a part in determining HCE then we should expect the system dummies to be both statistically significant and practically relevant which is the case here. - Thus there seems to be evidence for framework global budgeting and guiding incentives for GP’s in controlling health care expenditures. Large share of copayments and insurance coverage may cause ”billing or DRG-drift” and ”cost-slack” in care in insurance reimbursement and fee-for-service settings. - The tax based systems do well in HCE expenditures comparison to other financing forms (NHS-type systems of UK and Spain, Nordic local provision countries). 07/13/2010
- 2. Motivation: health care expenditure increase with the fast ageing population and advances in medicine and technology in industrialized countries – what role for the financing system in OECD ? • 0 In general there is no sizeable correlation between HCE and system type. • However… • • France Belgium Switzerland Germany Canada Portugal New Zealand Netherlands Denmark Sweden Italy Iceland Spain United… Ireland Norway Australia Finland Japan Slovak… Hungary Czech Republic Poland Luxembourg The figure depicts the relationship between health insurance and tax financed systems. • IF: One excludes the former eastern european transitional countries with low GDP levels • • Figure 1. Health expenditure in OECD countries in 2007 THEN: The taxed based systems of HCE financing are smaller in costs. Correlation (TAX,HCE)= R=0,05. RED = Social security or insurance fínancing GREEN = Tax based financing 1 2 3 4 5 6 7 8 9 10 11 12 1)Figure 1., source: OECD Health Data 2010, OECD. Western Europe (EUR): the Netherlands, France and Spain. Nordic countries (NORDIC): Norway, Sweden, Denmark (country group averages). 07/13/2010 Senior Researcher, Eero Siljander, Center for Health and Social Care Economics, National Institute for Health and Welfare.
- 3. Figure 2. Correlation between global budgeting (GLO), and fee-for-service (FFS) with displayed HCE expenditures in OECD countries, 2008. USA France Belgium Switzerland Germany Austria Canada Portugal New Zealand Netherlands Greece Denmark Sweden Italy Iceland Spain United Kingdom Ireland Norway Australia Finland Japan Slovak Republic Hungary Czech Republic Poland Luxembourg Korea Turkey Mexico Red = FFSs and no global budgets Green =Global budgets, No FFSs. Top bar=FFS Bottom bar= GLOBAL correlation (GLO, HCE)=, R=(-0,17). 5 07/13/2010 6 7 8 9 10 11 12 correlation(FFS, HCE)= R=+0,44. 13 14 15 Senior Researcher, Eero Siljander, Center for Health and Social Care Economics, National Institute for Health and Welfare. 16 17 3
- 4. The growth and adjustment of HCE • A. The growth in HCE expenditures is rapid with a nearly linear trend.->Growth has been nearly 50 percent in the timespan of 30 years from 1975 to 2005 • B. The adjustment parameter varies in the range 0,05-0,1 which refers to sluggish adjustment. There is persistent autocorrelation in the data which does not however capture all of the variation in HCE. The median lag length is between 3 to 10 years. -> The adjustment of HCE towards target becomes slower towards the end of the sample. Figure 3. Health care expenditure in sample by A.GDP-share change (right, pp.), B1. adjustment parameter and B2. public finance share (left, percent) adjustment parameter change in GDP-share public finance share 0.14 0.5 0.45 0.12 0.4 0.1 0.35 • 0.3 0.08 0.25 0.06 • 0.2 0.15 0.04 0.1 0.02 0.05 0 0 1975 07/13/2010 1980 1985 1990 1995 2000 2005 • C. The effect of public financing on total HCE has declined over time from 5 % to 3,5 % according to figure 6. This may point to the increased share of private funding but also to more cost-effective public use of finances. ->The impact of a +10 percent increase in public financing has an +0,5 to + 1,0 percentage point effect on health care expenditure on average. Senior Researcher, Eero Siljander, Center for Health and Social Care Economics, National Institute for Health and Welfare.
- 5. Explanatory factors contributing to HCE growth in developed OECD. • % Figure 4. The elasticity of health care expenditure by explanatory variable, (Y=HCE, percent change, 10 percent X-change). 10 • 8 6 4 • • 2 • 0 public exogenous urbanization doctors / female finance share technological rate inhabitants participation change -ratio rate -2 07/13/2010 • 1)-> For fee-for-service (FFS) in primary basic care: it is statistically significant and 22 percent higher in costs of other remunaration arrengements. 2)-> For the hospital global (GLO) budgeting: it is statistically significant and 34 percent lower in cost terms compared to the reference of other hospital financing arrengements. The increase in the urbanization rate by 10 percent increases expenditures by 8 percent (access to services), The growth in public HCE expenditures by 10 percent increases total expenditures by 4 percent, Exogenous technological change increase HCE expenditures by 2 percent, The same result of 2 percent holds for the one percent increase of practising physicians per capita. Senior Researcher, Eero Siljander, Center for Economics, National Institute for Health and Welfare. Health and Social Care