The Breast Journal 2011 Diffusion weighted Imaging in Evaluating the Response to Neoadjuvant Breast Cancer NAD DWI

The aim of this study was to investigate the role of diffusion imaging in the evaluation of response to neoadjuvant breast cancer treatment by correlating apparent diffusion coefficient (ADC) value changes with pathological response. From June 2007 to June 2009, all consecutive patients with histopathologically confirmed breast cancer undergoing neoadjuvant chemotherapy were enrolled. All patients underwent magnetic resonance imaging (MRI) (including diffusion sequence) before and after neoadjuvant treatment. The ADC values obtained using two different methods of region of interest (ROI) placement before and after treatment were compared with MRI response (assessed using RECIST 1.1 criteria) and pathological response (assessed using Mandard’s classification). Fifty-one women (mean age 48.41 years) were included in this study. Morphological MRI (RECIST classification) well evaluated the responder status after chemotherapy (TRG class; area-under-the-curve 0.865). Mean pretreatment ADC values obtained with the two different methods of ROI placement were 1.11 and 1.02 · 10)3 mm2 ⁄ seconds. Mean post-treatment ADC values were 1.40 and 1.35 · 10)3 mm2 ⁄ seconds, respectively. A significant inverse correlation between mean ADC increase and Mandard’s classifications was observed for both the methods of ADC measurements. Diagnostic performance analysis revealed that the single ROI method has a superior diagnostic accuracy compared with the multiple ROIs method (accuracy: 82% versus 74%). The coupling of the diffusion imaging with the established morphological MRI provides superior evaluation of response to neoadjuvant chemotherapy treatment in breast cancer patients compared with morphological MRI alone. There is a potential in the future to optimize patient therapy on the basis of ADC value changes. Additional works are needed to determine whether these preliminary observed changes in tumor diffusion are a universal response to tumor cell death, and to more fully delineate the ability of ADC value changes in early recognizing responder from nonresponder patients.
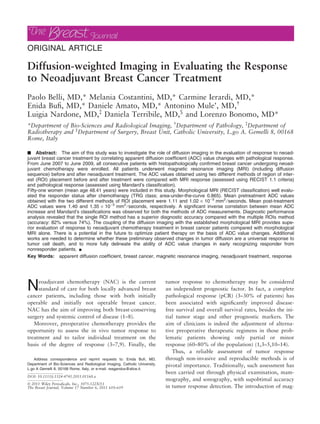
![netic resonance imaging (MRI) has improved the diag-
nostic accuracy of the breast cancer response to che-
motherapy by measuring tumor diameter changes and
by evaluating the vitality of residual tumor areas
(2,3,5,7,8,15–22). However, two major mismatches
have been evidenced between the MRI and the histo-
pathologic results. The first limitation of MRI is repre-
sented by its low power to detect ductal carcinoma in
situ (DCIS) or microscopic disease within multifocal
cancer. Nevertheless, it is has been demonstrated that
this limitation does not influence the long-term dis-
ease-free and overall survival of patients (6). Second,
the MRI can often overestimate the burden of residual
tumor by confounding a fibrotic scar with viable
tumor tissue. During and after NAC, tumor bed
enhancement reflects both the vascularity of residual
tumor and the effects of chemotherapy on tissue. This
makes the dynamic findings difficult to interpret
(1,23–26).
To improve the diagnostic performance of MRI
and to overcome the above limitations, we tested the
use of the diffusion-weighted-imaging (DWI) sequence.
Recent studies have proposed the DWI as an assess-
ment of tumor response to treatment. DWI reflects the
thermally driven motion of water molecules in the tar-
get tissue, thus providing information on the intrinsic
characteristics of tissue microstructure (volume and
arrangement of intracellular and extracellular spaces,
cellular membrane integrity and permeability).
However, the apparent diffusion coefficient (ADC)
quantifies the water diffusion within the tissue.
(4,8,20,25–32). There are few data over the capability
of DWI sequence in evaluating the histopathologic
response to treatment. Additionally, there is no
evidence available over the differential diagnostic
performance of the two different methods of ADC
assessment, namely the single region of interest (ROI)
versus the multiple ROIs method.
The present study was designed to address the
sensitivity, specificity and accuracy of MRI morpho-
logical sequences in evaluating the tumor response
to treatment (in particular, the responder versus the
nonresponder status). Further study objectives were
the depiction of the role of diffusion imaging in the
evaluation of breast cancer response to neoadjuvant
treatment (correlation of ADC value changes with
the pathological response according to a standard-
ized classification). Finally, we addressed the accu-
racy of the two above-mentioned methods of ROI
placement.
MATERIALS AND METHODS
Patients Selection
From June 2007 to June 2009, we prospectively
enrolled consecutive patients with histopathologically
proven invasive breast cancer (core-needle biopsy)
scheduled for NAC at the Breast Unit of our
hospital.
Study design comprised pre-NAC MRI imaging
(within 4 weeks before start of chemotherapy proto-
col), post-NAC MRI imaging, and definitive surgery
within 4 weeks after the completion of chemotherapy.
Exclusion criteria were incomplete or non-optimal
MRI study, surgery or definitive pathological diagno-
sis obtained outside, and non-completion of the
planned chemotherapy protocol. The NAC protocol
was managed by clinical oncologists at our Institution.
The final diagnosis of tumor response to neoadju-
vant treatment was classified according to the histo-
pathological Mandard’s TRG (Tumor Regression
Grade) criteria after surgical excision (33). The diag-
nostic performance of MRI imaging (either morpho-
logical or diffusion imaging) was weighted against the
results of TRG classification.
As the study protocol did not entail any additional
diagnostic or therapeutic intervention than routine
clinical management, and as the patients’ data were
treated anonymously, signed informed consent to
enter the present study was not deemed necessary.
Given the prospective nature of the study, IRB
approval of the study protocol was obtained.
MRI Protocol
All patients gave written informed consent to
undergo MRI and the MRI was performed with a 1.5
T unit with 23 mT⁄m gradient intensity (Signa Excite;
GE Medical System, Milwaukee, WI) with women in
the prone position using a dedicated breast coil.
The following sequences were acquired:
1. STIR axial sequence (short time inversion recov-
ery; repetition time [TR] = 5900, echo time [TE] = 68,
echo train length [ETL] = 17, bandwidth 41–67,
512 · 512 matrix, thickness = 4 mm, 0 interval, field-
of-view [FOV] = 32–34 cm, Number of Excitation
[NEX] = 1–2).
2. DWI axial sequence (TR = 5150, TE = min, fre-
quency-phase 96 · 96, 256 · 256 matrix, thick-
ness = 4 mm, 0 interval, FOV = 32–34 cm, NEX = 2).
DWI was acquired before dynamic sequences with a
DWI and Response to Neoadjuvant Chemotherapy • 611](data:image/gif;base64,R0lGODlhAQABAIAAAAAAAP///yH5BAEAAAAALAAAAAABAAEAAAIBRAA7)
Recommended
Recommended
More Related Content
More from Karolinska Institutet, University of Bergen, University of Oslo
More from Karolinska Institutet, University of Bergen, University of Oslo (11)
Recently uploaded
Recently uploaded (20)
The Breast Journal 2011 Diffusion weighted Imaging in Evaluating the Response to Neoadjuvant Breast Cancer NAD DWI
- 1. ORIGINAL ARTICLE Diffusion-weighted Imaging in Evaluating the Response to Neoadjuvant Breast Cancer Treatment Paolo Belli, MD,* Melania Costantini, MD,* Carmine Ierardi, MD,* Enida Bufi, MD,* Daniele Amato, MD,* Antonino Mule’, MD, Luigia Nardone, MD,à Daniela Terribile, MD,§ and Lorenzo Bonomo, MD* *Department of Bio-Sciences and Radiological Imaging, Department of Pathology, à Department of Radiotherapy and § Department of Surgery, Breast Unit, Catholic University, L.go A. Gemelli 8, 00168 Rome, Italy n Abstract: The aim of this study was to investigate the role of diffusion imaging in the evaluation of response to neoad- juvant breast cancer treatment by correlating apparent diffusion coefficient (ADC) value changes with pathological response. From June 2007 to June 2009, all consecutive patients with histopathologically confirmed breast cancer undergoing neoad- juvant chemotherapy were enrolled. All patients underwent magnetic resonance imaging (MRI) (including diffusion sequence) before and after neoadjuvant treatment. The ADC values obtained using two different methods of region of inter- est (ROI) placement before and after treatment were compared with MRI response (assessed using RECIST 1.1 criteria) and pathological response (assessed using Mandard’s classification). Fifty-one women (mean age 48.41 years) were included in this study. Morphological MRI (RECIST classification) well evalu- ated the responder status after chemotherapy (TRG class; area-under-the-curve 0.865). Mean pretreatment ADC values obtained with the two different methods of ROI placement were 1.11 and 1.02 · 10)3 mm2 ⁄ seconds. Mean post-treatment ADC values were 1.40 and 1.35 · 10)3 mm2 ⁄ seconds, respectively. A significant inverse correlation between mean ADC increase and Mandard’s classifications was observed for both the methods of ADC measurements. Diagnostic performance analysis revealed that the single ROI method has a superior diagnostic accuracy compared with the multiple ROIs method (accuracy: 82% versus 74%). The coupling of the diffusion imaging with the established morphological MRI provides supe- rior evaluation of response to neoadjuvant chemotherapy treatment in breast cancer patients compared with morphological MRI alone. There is a potential in the future to optimize patient therapy on the basis of ADC value changes. Additional works are needed to determine whether these preliminary observed changes in tumor diffusion are a universal response to tumor cell death, and to more fully delineate the ability of ADC value changes in early recognizing responder from nonresponder patients. n Key Words: apparent diffusion coefficient, breast cancer, magnetic resonance imaging, neoadjuvant treatment, response Neoadjuvant chemotherapy (NAC) is the current standard of care for both locally advanced breast cancer patients, including those with both initially operable and initially not operable breast cancer. NAC has the aim of improving both breast-conserving surgery and systemic control of disease (1–8). Moreover, preoperative chemotherapy provides the opportunity to assess the in vivo tumor response to treatment and to tailor individual treatment on the basis of the degree of response (3–7,9). Finally, the tumor response to chemotherapy may be considered an independent prognostic factor. In fact, a complete pathological response (pCR) (3–30% of patients) has been associated with significantly improved disease- free survival and overall survival rates, besides the ini- tial tumor stage and other prognostic markers. The aim of clinicians is indeed the adjustment of alterna- tive preoperative therapeutic regimens in those prob- lematic patients showing only partial or minor response (60–80% of the population) (1,3–5,10–14). Thus, a reliable assessment of tumor response through non-invasive and reproducible methods is of pivotal importance. Traditionally, such assessment has been carried out through physical examination, mam- mography, and sonography, with supobtimal accuracy in tumor response detection. The introduction of mag- Address correspondence and reprint requests to: Enida Bufi, MD, Department of Bio-Sciences and Radiological Imaging, Catholic University, L.go A Gemelli 8, 00168 Rome, Italy, or e-mail: reagandus@alice.it. DOI: 10.1111/j.1524-4741.2011.01160.x 2011 Wiley Periodicals, Inc., 1075-122X/11 The Breast Journal, Volume 17 Number 6, 2011 610–619
- 2. netic resonance imaging (MRI) has improved the diag- nostic accuracy of the breast cancer response to che- motherapy by measuring tumor diameter changes and by evaluating the vitality of residual tumor areas (2,3,5,7,8,15–22). However, two major mismatches have been evidenced between the MRI and the histo- pathologic results. The first limitation of MRI is repre- sented by its low power to detect ductal carcinoma in situ (DCIS) or microscopic disease within multifocal cancer. Nevertheless, it is has been demonstrated that this limitation does not influence the long-term dis- ease-free and overall survival of patients (6). Second, the MRI can often overestimate the burden of residual tumor by confounding a fibrotic scar with viable tumor tissue. During and after NAC, tumor bed enhancement reflects both the vascularity of residual tumor and the effects of chemotherapy on tissue. This makes the dynamic findings difficult to interpret (1,23–26). To improve the diagnostic performance of MRI and to overcome the above limitations, we tested the use of the diffusion-weighted-imaging (DWI) sequence. Recent studies have proposed the DWI as an assess- ment of tumor response to treatment. DWI reflects the thermally driven motion of water molecules in the tar- get tissue, thus providing information on the intrinsic characteristics of tissue microstructure (volume and arrangement of intracellular and extracellular spaces, cellular membrane integrity and permeability). However, the apparent diffusion coefficient (ADC) quantifies the water diffusion within the tissue. (4,8,20,25–32). There are few data over the capability of DWI sequence in evaluating the histopathologic response to treatment. Additionally, there is no evidence available over the differential diagnostic performance of the two different methods of ADC assessment, namely the single region of interest (ROI) versus the multiple ROIs method. The present study was designed to address the sensitivity, specificity and accuracy of MRI morpho- logical sequences in evaluating the tumor response to treatment (in particular, the responder versus the nonresponder status). Further study objectives were the depiction of the role of diffusion imaging in the evaluation of breast cancer response to neoadjuvant treatment (correlation of ADC value changes with the pathological response according to a standard- ized classification). Finally, we addressed the accu- racy of the two above-mentioned methods of ROI placement. MATERIALS AND METHODS Patients Selection From June 2007 to June 2009, we prospectively enrolled consecutive patients with histopathologically proven invasive breast cancer (core-needle biopsy) scheduled for NAC at the Breast Unit of our hospital. Study design comprised pre-NAC MRI imaging (within 4 weeks before start of chemotherapy proto- col), post-NAC MRI imaging, and definitive surgery within 4 weeks after the completion of chemotherapy. Exclusion criteria were incomplete or non-optimal MRI study, surgery or definitive pathological diagno- sis obtained outside, and non-completion of the planned chemotherapy protocol. The NAC protocol was managed by clinical oncologists at our Institution. The final diagnosis of tumor response to neoadju- vant treatment was classified according to the histo- pathological Mandard’s TRG (Tumor Regression Grade) criteria after surgical excision (33). The diag- nostic performance of MRI imaging (either morpho- logical or diffusion imaging) was weighted against the results of TRG classification. As the study protocol did not entail any additional diagnostic or therapeutic intervention than routine clinical management, and as the patients’ data were treated anonymously, signed informed consent to enter the present study was not deemed necessary. Given the prospective nature of the study, IRB approval of the study protocol was obtained. MRI Protocol All patients gave written informed consent to undergo MRI and the MRI was performed with a 1.5 T unit with 23 mT⁄m gradient intensity (Signa Excite; GE Medical System, Milwaukee, WI) with women in the prone position using a dedicated breast coil. The following sequences were acquired: 1. STIR axial sequence (short time inversion recov- ery; repetition time [TR] = 5900, echo time [TE] = 68, echo train length [ETL] = 17, bandwidth 41–67, 512 · 512 matrix, thickness = 4 mm, 0 interval, field- of-view [FOV] = 32–34 cm, Number of Excitation [NEX] = 1–2). 2. DWI axial sequence (TR = 5150, TE = min, fre- quency-phase 96 · 96, 256 · 256 matrix, thick- ness = 4 mm, 0 interval, FOV = 32–34 cm, NEX = 2). DWI was acquired before dynamic sequences with a DWI and Response to Neoadjuvant Chemotherapy • 611
- 3. spin echo EPI sequence in the axial plane. Sensitizing diffusion gradients were applied sequentially in the x-, y-, and z- directions with b values of 0 and 1,000 seconds⁄mm2 , according to the pertinent literature (34–37). 3. Three-dimensional (3D) FSPGR (fast spoiled gra- dient echo) fat sat coronal sequence (FA [flip- angle] = 15, TR 30 ms, TE 5 ms, NEX = 0.5, thickness = 2–3 mm, 0 interval, 512 · 512 matrix, FOV = 34–38 cm) before and five times after intrave- nous administration of 0.1 mmol⁄kg of Gd-DTPA (Gadopentetate dimeglumine; Bracco Diagnostics, Milan, Italy). Contrast medium was injected with a 10 seconds of timing delay into the antecubital vein with a 18–20 G needle at a flow rate of 2 mL⁄seconds followed by a flush of 20 mL of saline solution. 4. 3D FSPGR sagittal postcontrast fat-suppressed sequence (TR30, TE5, FA = 15, 512 · 512 matrix, thickness = 2–3 mm, 0 interval, FOV = 22–26 cm, NEX = 2). 5. 3D FSPGR axial postcontrast fat-suppressed sequence (TR30, TE5, FA = 30, 512 · 512 matrix, thickness = 2–3 mm, 0 interval, FOV = 34–38 cm, NEX = 2). Acquisition time of this complete MRI protocol was 18–20 minutes. Dynamic and DWI sequences were evaluated using a dedicated workstation (GE Healthcare , Advantage Windows 4.1) by the consensus of two radiologists (MC and PB authors) experienced in breast imaging. The tumor response to treatment was assessed using RECIST 1.1 (Response Evaluation Criteria in Solid Tumors) classification (38), based on the longest diameter measure of the target lesion (postcontrast fat-suppressed 3D FSPGR T1-weighted images). In the presence of a multifocal or multicentric disease, the largest lesion was considered as the target one. Accordingly, we identified four groups: 1. Complete response (CR): complete disappearance of lesion. 2. Partial response (PR): at least a 30% decrease in longest diameter. 3. Progressive disease (PD): at least a 20% increase in tumor size. 4. Stable disease (SD): neither sufficient shrinkage to qualify for PR nor sufficient increase to qualify for PD. For each target lesion, we evaluated the DWI sequence and measured the ADC values before and after the chemotherapy according to the following formula: ADC = (lnS0)lnS)⁄b (where S0 is signal intensity obtained at b = 0 and S is signal intensity obtained at b = 1,000), directly applied by the pro- gram. Two different methods of measure were recorded for each lesion: 1. A single ROI was positioned on the slice corre- sponding to the maximum diameter of the lesion (‘‘Single ROI’’ method); 2. Five small ROIs (100 pixels) were positioned on different slices within the lesion, to exclude cystic or necrotic areas. Subsequently, the mean value was calculated (‘‘Multiple ROIs’’ method). Previous literature is available over both the single ROI method (35) and the multiple ROIs method (39). In case of tumor fragmentation, the single ROI included the entire area involved by the lesion together with the interspersed areas without signal hy- perintensity. However, the five small ROIs were posi- tioned only in the residual hyperintensity areas. In case of absence of hyperintensity areas, we measured the ADC value in the previous site of lesion. Pathological Examination Breast surgical specimens were cut into 5-mm slices, fixed in 10% neutral-buffered formalin, and stained with hematoxylin and eosin (H E) for evaluation. Macroscopic inspection of the specimens was used to identify gross tumor areas for subsequent microscopic assessment. Whether gross tumor was not macroscopi- cally evident, each paraffin block was sliced and the tumor bed was identified by correlation with imaging findings and radiography of specimens. The size of tumor bed, the largest focus of contiguous invasive car- cinoma and the number of invasive foci were recorded. Residual disease post-NAC was assessed according to the Mandard’s classification (40) based on grade of tumor regression. Five classes of pathological response were recorded: 1. TRG1: complete regression, absence of residual tumor cells. 2. TRG2: presence of rare residual cancer cells scat- tered through the fibrosis. 3. TRG3: increase in the number of residual cancer cells, but fibrosis still predominated. 4. TRG4: residual cancer outgrowing fibrosis. 5. TRG5: absence of regressive changes. For data analysis, we defined the ‘‘Responder’’ patients those having TRG class 1, 2, or 3, and the ‘‘Nonresponder’’ patients those having TRG class 4 or 5. Similarly, under the profile of morphological MRI, we defined the ‘‘Responder’’ patients those having 612 • belli et al.
- 4. Complete Response or Partial Response, and the ‘‘Nonresponder’’ patients those having Stable of Pro- gressive Disease (RECIST 1.1). Concerning the diag- nostic performance analysis of diffusion imaging, we defined the ADC variation as the post-treatment ADC minus the pretreatment ADC for each lesion. Finally, we assumed a cutoff value of ‡20% increase in ADC value after the chemotherapy treatment as indicative of response to treatment itself. A battery of different potential cutoff values were tested within our dataset, and diagnostic accuracy⁄receiver operator characteris- tic (ROC) curves were determined for each of them. The ‡20% increase in ADC value was identified as the cutoff having the best diagnostic performance; detailed data relative to the excluded cutoff values were not shown due to space issues. Statistical Analysis The statistical analysis was performed using SPSS version 11.0 for Windows (Statistical Package for Social Sciences, SPSS, Chicago, IL). Continuous data are pre- sented as mean ± standard deviation and categorical variables as percentages. Intergroup mean comparison was performed using two-tailed Student’s t-test for paired samples, or using one-way analysis of variance (ANOVA) for multiple-groups comparison. Kendall’s rank-correlation coefficient (tau) was used to analyze the correlation between the Mandard’s classification and the variation of ADC after versus before the chemotherapy treatment. Both methods of ADC assess- ment were evaluated. Subsequently, Kendall’s coeffi- cient was used to investigate the correlation between the Mandard’s classification and the RECIST class. Diagnostic performance of test (value of either method of ADC assessment in evaluating the response or nonre- sponse status of a tumor lesion) was performed by cal- culation of sensitivity, specificity and diagnostic accuracy. Adequate ROC curves were built. Subse- quently, the ROC curves obtained with either method were statistically compared according to the Hanley and McNeil methodology (41), using the MedCalc soft- ware for Windows (MedCalc, Broekstraat 52, B-9030 Mariakerke, Belgium). The alpha level was 0.05. RESULTS Characteristics of the Population The study design is summarized in Fig. 1. A total of 200 patients were initially enrolled and underwent pretreatment MRI. Of these, 62 were excluded as they had excision surgery of breast lesion before chemo- therapy, 30 did not complete their chemotherapy pro- tocol due to toxicity and 12 refused the post-treatment MRI. Ninety-six patients had their post-treatment MRI; of these, 45 had their excision surgery of breast lesion with histologic exam within another Institution. Thus, we had complete data for 51 patients. These constituted the final study popula- tion. Mean age at diagnosis was 48.41 ± 10.18 years (range: 26–66 years). Pretreatment core-needle biopsies revealed 40 inva- sive ductal carcinomas (including two cases of mixed invasive ⁄in situ ductal carcinomas), seven invasive lobular carcinomas, and four poorly differentiated carcinomas. In 29 cases (56.86%), the left breast was affected. From these, the external upper quadrants were involved in 19 cases (65.51%). There were 37 cases (72.54%) of axillary lymph nodes metastases and three cases (5.88%) of distant metastases. Conven- tional MRI showed 34 cases of unifocal disease and 17 cases of multifocal ⁄multicenter disease. Under the morphological point of view, breast cancer appeared as a mass in 37 cases and as diffuse enhancement in 14 cases. Mean pretreatment diameter obtained with MRI was 50.23 ± 19.98 mm (range: 18–90 mm). Mean pretreatment ADC value obtained with the single ROI method was 1.11 ± 0.16 · 10)3 mm2 ⁄ Figure 1. Study design. DWI and Response to Neoadjuvant Chemotherapy • 613
- 5. seconds (range 0.82–1.55). Mean pretreatment ADC value obtained with the multiple ROIs method was 1.03 ± 0.15 · 10)3 mm2 ⁄seconds (range 0.78–1.42) (Fig. 2). We observed no statistically significant differ- ence in mean pretreatment ADC value between responder and nonresponder patients. The neoadjuvant regimens used in our patients were FEC (Fluorouracil + Epirubicin + Cyclophospha- mide) in six cases, AT (Doxorubicin + Taxanes) in 23 cases, TAC (Taxanes + Doxorubicin + Cyclophospha- mide) in nine cases, and TC (Taxanes + Cyclophos- phamide) ± carboplatinum or trastuzumab in 13 cases, given 3-weekly for 4–6 cycles. The total treatment period ranged from 56 to 224 days (mean, 132 days). Mean post-treatment diameter obtained with MRI measurements was 27.74 ± 23.21 mm (range: 0– 85 mm). Based on dynamic and morphological changes, con- ventional MRI (according to RECIST 1.1 criteria) identified 11 cases of complete response to treatment, 21 cases of partial response, and 19 cases of stable disease. No patient showed progressive disease. Defini- tive pathological analysis according to the Mandard’s classification confirmed five cases of TGR1, nine cases of TGR2, 11 cases of TGR3, 18 cases of TGR4, and eight cases of TGR5. Mean post-treatment ADC value obtained with the single ROI method and the multiple ROIs method was 1.40 ± 0.30 · 10)3 mm2 ⁄seconds (range 0.69– 2.00) and 1.35 ± 0.28 · 10)3 mm2 ⁄seconds (range 0.73–1.99), respectively (Fig. 3). At the end of the neoadjuvant treatment, we observed a statistically significant increase in mean ADC value assessed by either methodology (p 0.001 for both the single ROI method and the multiple ROIs method) (Fig. 4). Diagnostic Performance We assessed the diagnostic performance of both the morphological MRI imaging and the DWI sequence. Our data confirm previous findings that the morpho- logical MRI imaging according to the RECIST classifi- cations well evaluates the TRG histologic response (sensitivity 96%, specificity 73%, diagnostic accuracy 84% in our series). Such concept is supported even by the ROC curve for our data (area-under-the-curve 0.865) (graph not shown). (a) (c) (d) (b) Figure 2. Pre-NAC DWI images and ADC maps for the multiple ROIs method (a and b) and the single ROI method (c and d). 614 • belli et al.
- 6. Concerning the DWI sequence, mean ADC varia- tion after neoadjuvant treatment was maximal among patients having TRG class 1, and progressively decreased in class 2 toward class 5 for both the single ROI and the multiple ROIs methods (Table 1). Such variation was statistically significant according to the ANOVA analysis (p = 0.001 for the single ROI method and p 0.001 for the multiple ROIs method). We observed a statistically significant inverse correlation between the percentage variation of ADC (single ROI method) and the TRG class (tau = )0.415, p 0.001). Similarly, an inverse corre- lation exists between the percentage ADC variation obtained by the multiple ROIs method and the TRG class (tau = )0.445, p 0.001). Subsequently, we compared the diagnostic perfor- mance of the single ROI versus the multiple ROIs method. For this purpose, we grouped the TRG (a) (c) (d) (b) Figure 3. Post-NAC DWI images and ADC maps for the multiple ROIs method (a and b) and the single ROI method (c and d). (a) (b) Figure 4. Box plot for mean ADC value comparison: pre-NAC versus post-NAC mean ADC values for the Single ROI method (a) and the Multiple ROIs method (b). DWI and Response to Neoadjuvant Chemotherapy • 615
- 7. classes according to the responder (TRG class 1, 2, and 3) or nonresponder (TRG class 4 and 5) status, and corresponding ROC curves were built. For the single ROI method, we observed a 0.804 area-under- the-curve (evaluation of the responder status by ADC variation) (Fig. 5a). However, a 0.746 area-under-the- curve was calculated for the multiple ROIs method (Fig. 5b). Accordingly, the two ROI placement meth- ods displayed similar sensitivity (80% both), but supe- rior specificity was observed for the single ROI method (84% versus 69%). Thus, the single ROI method displayed a higher overall diagnostic accuracy (82% versus 74%). However, when comparing the two ROC curves according to the Hanley and McNeil methodology, there appeared to be no statistically sig- nificant difference (p = 0.74, z statistic = 0.32). DISCUSSION Dynamic contrast-enhanced RMI and more recently DWI have demonstrated relevant abilities in assessing tumor progression and⁄or responses to chemotherapy. However, it has been suggested that the morphologi- cal MRI imaging alone has suboptimal capability to differentiate among the scar tissue and the viable tumor tissue, and may overestimate or underestimate the residual tumor size (2–8,15–25). This potentially generates false positive results and leads to misrecog- nize a proportion of responder patients, with ensuing suboptimal clinical management. Our data indicate that the DWI sequence can be proficiently used to fill such diagnostic gap. In our series, we confirm the above limitation of DCE-MRI. In fact, the mor- phological MRI imaging showed an excellent sensitiv- ity (96%) coupled with a fairly lower specificity (73%) in evaluating the histologic response to NAC (TRG classification). Overall diagnostic accuracy was 84%. When taking the DWI imaging into analysis, we found that the mean ADC values significantly increased after the NAC treatment. The effects of che- motherapy are registered as an increase in ADC value, in consequence of cellular damage (25–32,42–48). Changes in ADC may be a generalized measure of cytotoxic response to chemotherapy. The nature of the cytological changes that gives rise to these ADC changes is not well defined. Current models indicate that increases in ADC are consistent with an increase in tissue water mobility, which can be achieved through cell shrinkage, breakdown of the plasma membrane, or increase in the nuclear⁄cytoplasmic ratio (8,9). Table 1. Mean Increase of ADC Value in Relation to Pathological Response Mandard’s classifications Mean ADC difference for single ROI method Mean ADC difference for multiple ROIs method TRG1 0.63 0.68 TRG2 0.42 0.47 TRG3 0.36 0.38 TRG4 0.17 0.2 TRG5 0.09 0.16 (a) (b) Figure 5. Diagnostic performance of ADC increase after NAC (20% increase as cutoff value for responder status) for the Single ROI method (a) and the Multiple ROIs method (b). 616 • belli et al.
- 8. Our findings of increased ADC value after chemo- therapy confirm previous results (4,8,20,25,39). The referenced studies, however, while evaluating the DWI sequence as a predictor of tumor response, did not use a formal classification of histopathologic response to address this point. As such, several investigations are limited by little sample size (8) or poor definition of histopathologic response outcome measurement (4). To overcome such limitations, we adopted the formal TRG histopathologic classification as the outcome measure of our study for tumor response. We dis- carded all patients without complete in-house evalua- tion, to increase the homogeneity of outcome measure data and the reliability of the conclusions, and to reduce the selection bias. For our analysis, we calcu- lated the variation of ADC value prior versus post- NAC in each patient, and the mean variation value was made available. Our ANOVA model disclosed a statistically significant increase in the mean ADC vari- ation value across the five TRG classes, with class 1 (complete response) showing the larger mean variation (i.e., larger post-NAC mean ADC increase) and class 5 (stable disease) showing the lesser mean variation (i.e., lesser post-NAC ADC increase or almost no increase) (p = 0.001). The mean variation of ADC decreased linearly with increase in the TRG class (Table 1). The finding of a statistically significant inverse correlation (Kendall’s tau) between the ADC variation and the TRG classes supports this concept. We did not find a statistically significant difference in pretreatment ADC value among the responder versus the nonresponder patients. This finding is in contrast with previous evidence (4). Such discrepancy may be attributed to a different definition of the responder sta- tus, which, in the above-referenced study, was based on the variation in tumor size after NAC (DCE-MRI). Conversely, we defined the response to NAC on the basis of histopathologic assessment: patients having TRG classes 1, 2, and 3 were defined as responders; otherwise, patients having TRG class 4 or 5 were defined as nonresponders. We believed that the histo- pathologic classification should be considered as the true standard for the outcome measure in our study. Under the profile of assessment of the ADC value, two alternative methods are currently available (the Single ROI versus the Multiple ROIs method). These methods have been variably employed in the studies published so far; however, a direct benchmark compari- son of their differential performance in the same popu- lation is required. For this purpose, for each patient included in our study, we measured the ADC value using both methods at each time point, and conducted a formal diagnostic performance analysis for both of them. Both methodologies disclosed a statistically sig- nificant difference in pre-NAC versus post-NAC mean ADC value (p 0.001 for both Single ROI and Multi- ple ROIs method). In addition, the inverse correlation between ADC value variation and TRG class was statis- tically significant for both methods, showing similar tau coefficients ()0.415 and )0.445, Single ROI versus Multiple ROIs method). However, when introducing more refined tests of diagnostic performance (ROC curves), it emerges that the Single ROI method has a fairly better diagnostic performance in evaluating the responder status (TRG classification). We adopted a 20% increase in ADC value (post-NAC versus pre- NAC) as a cutoff measurement to define the responder status on the basis of the DWI sequence, and compared the DWI status findings with the histopathologic responder⁄nonresponder status (TRG). Based on such definitions, the Single method showed a 0.804 area under the curve, 80% sensitivity, 84% specificity, and 82% accuracy. Conversely, the Multiple ROIs method was characterized by a 0.746 area under the curve, 80% sensitivity, 69% specificity and 74% diagnostic accuracy. Thus, the better diagnostic performance of the Single ROI method can be attributed essentially to a superior specificity than the Multiple ROIs method. Actually, in the Multiple ROIs method, five ROIs are manually selected by each individual examiner in the context of the hyperintensity areas, with the scope of avoiding measurement bias due to central necrotic areas. Despite this methodology should ideally confine the analysis to the only viable areas of the tumor, our findings actually indicate that the Single ROI method displays a better diagnostic performance for the histo- pathologic response to treatment. Nonetheless, we failed to demonstrate a statistically significant differ- ence among ROC curves obtained for either method, possibly due to scarce sample size. While the two meth- ods may be regarded as essentially equivalent to evalu- ate the response to NAC, the Single ROI method can be proposed for routine use in the evaluation of breast can- cer in consideration of its performance, reproducibility, and rapidity. The above-mentioned cutoff for ADC value increase (20%) provided the better diagnostic performance among a battery of potential cutoff values (data not shown). Conventional MRI is the current gold-standard for the reassessment of breast cancer during treatment DWI and Response to Neoadjuvant Chemotherapy • 617
- 9. protocols; however, it is limited by the need to admin- ister contrast agent. Our data indicate that the single ROI method may be comparable to conventional MRI in terms of diagnostic accuracy. As the DWI sequence requires no injection of contrast agent, it is reasonable to foresee its expanding role during the NAC cycles and after surgery. Patients with contrast medium intolerance and renal failure may particularly benefit from this strategy. We acknowledge the lack of mid-term data for his- topathology, DCE-MRI, and DWI as a potential study limitation. However, our purpose was limited to the assessment of the diagnostic value of DWI at the end of the entire NAC treatment. Other studies performed complete reassessment of the lesions between each NAC cycle (25,39,41); further investigations of these points are encouraged. In addition, our patients under- went a number of different NAC protocols, which may theoretically represent a confounder. However, in our global analysis, we disclosed evident results over the variation of mean ADC values and their potential to evaluate the tumor response; as such, studies with larger sample sizes are required to perform an assess- ment of DWI performance in different NAC protocol subgroups. CONCLUSION The significant changes that occurred in ADC val- ues after NAC suggest that this parameter could be a useful biomarker for assessing response to therapy in breast tumors. The relationship between ADC changes and the degree of response is of particular interest due to the current paucity of data existing in the literature. Determination of ADC is time-saving, requires no injection of contrast agents, and may be considered an addition tool to tailor the individual patients’ treat- ment. There is a potential in the future to optimize patient therapy on the basis of the application of DWI to monitor effective response at an early stage of treatment. REFERENCES 1. Chen JH, Feig B, Agrawal G, et al. MRI evaluation of patho- logically complete response and residual tumors in breast cancer after neoadjuvant chemotherapy. Cancer 2008;112:17–26. 2. Johansen R, Jensen LR, Rydland J, et al. Predicting survival and early clinical response to primary chemotherapy for patients with locally advanced breast cancer using DCE-MRI. J Magn Reson Imaging 2009;29:1300–7. 3. Kim HJ, Im YH, Han BK, et al. Accuracy of MRI for esti- mating residual tumor size after neoadjuvant chemotherapy in locally advanced breast cancer: relation to response patterns on MRI. Acta Oncol, 2007;46:996–1003. 4. Iacconi C, Giannelli M, Marini C, et al. The role of mean diffusivity (MD) as a predictive index of the response to chemother- apy in locally advanced breast cancer: a preliminary study. Eur Radiol 2010;20:303–8. 5. Loo CE, Teertstra HJ, Rodenhuis S, et al. Dynamic contrast- enhanced MRI for prediction of breast cancer response to neoadju- vant chemotherapy: initial results. AJR 2008;191:1331–8. 6. Gralow JR, Burstein HJ, Wood W, et al. Preoperative ther- apy in invasive breast cancer: pathologic assessment and systemic therapy issues in operable disease. J Clin Oncol 2008;26:814–9. 7. Segara D, Krop IE, Garber JE, et al. Does MRI predict path- ologic tumor response in women with breast cancer undergoing pre- operative chemotherapy? J Surg Oncol 2007;96:474–80. 8. Yankeelova TE, Lepagea M, Chakravarthyf A, et al. Integra- tion of quantitative DCE-MRI and ADC mapping to monitor treatment response in human breast cancer: initial results. Magn Reson Imaging, 2007;25:1–13. 9. Morse DL, Galons JP, Payne CM, et al. MRI-measured water mobility increases in response to chemotherapy via multiple cell-death mechanisms. NMR Biomed 2007;20:602–61. 10. Chang J, Powles TJ, Allred DC, et al. Biologic markers as predictors of clinical outcome from systemic therapy for primary operable breast cancer. J Clin Oncol 1999;17:3058–63. 11. Rajan R, Poniecka A, Smith TL, et al. Change in tumor cel- lularity of breast carcinoma after neoadjuvant chemotherapy as a variable in the pathologic assessment of response. Cancer 2004;7:1365–73. 12. Rastogi P, Anderson SJ, Bear HD, et al. Preoperative chemo- therapy: updates of national surgical adjuvant breast and bowel project protocols B-18 and B-27. J Clin Oncol 2008;26:778–85. 13. Smith IC, Heys SD, Hutcheon AW, et al. Neoadjuvant chemotherapy in breast cancer: significantly enhanced response with docetaxel. J Clin Oncol 2002;20:1456–66. 14. Kuerer HM, Newman LA, Smith TL, et al. Clinical course of breast cancer patients with complete pathologic primary tumor and axillary lymph node response to doxorubicin-based neoadjuvant chemotherapy. J Clin Oncol 1999;17:460–9. 15. Balu-Maestro C, Chapellier C, Bluese A, et al. Imaging in evaluation of response to neoadjuvant breast cancer treatment bene- fits of MRI. Breast Cancer Res Treat 2002;72:145–52. 16. Delille J-P, Slanetz PJ, Yeh ED, et al. Invasive ductal breast carcinoma response to neoadjuvant chemotherapy: noninvasive monitoring with functional MR imaging – pilot study. Radiology 2003;228:63–9. 17. Gilles R, Guinebretiere JM, Toussaint C, et al. Locally advanced breast cancer: contrast-enhanced subtraction MR imaging of response to preoperative chemotherapy. Radiology 1994; 191:633–8. 18. Heywang-Koebrunner SH. Breasts. In: Bradley WG, Stark DD, eds. Magnetic Resonance Imaging. St. Louis (Mo)7 Mosby: Mosby Inc., 1999:1401–28. 19. Londero V, Bazzocchi M, Del Frate C, et al. Locally advanced breast cancer: comparison of mammography, sonography and MR imaging in evaluation of residual disease in women receiv- ing neoadjuvant chemotherapy. Eur Radiol 2004;14:1371–9. 20. Pickles MD, Gibbs P, Lowry M, Turnbull LW. Diffusion changes precede size reduction in neoadjuvant treatment of breast cancer. Magn Reson Imaging 2006;24:843–7. 618 • belli et al.
- 10. 21. Rieber A, Brambs HJ, Gabelmann A, et al. Breast MRI for monitoring response of primary breast cancer to neoadjuvant chemotherapy. Eur Radiol 2002;12:1711–9. 22. Schott AF, Roubidoux MA, Helvie MA, et al. Clinical and radiologic assessments to predict breast cancer pathologic complete response to neoadjuvant chemotherapy. Breast Cancer Res Treat 2005;92:231–8. 23. Partrige SC, Gibbs JE, Lu Y, et al. Accuracy of MRI imaging for revealing residual breast cancer in patients who have undergone neoadjuvant chemotherapy. AJR 2002;179:1193–9. 24. Rosen EL, Blackwell KL, Baker JA, et al. Accuracy of MRI in the detection of residual breast cancer after neoadjuvant chemo- therapy. AJR 2003;181:1275–82. 25. Sharmaa U, Danishada KKA, Seenub V, Jagannathana NR. Longitudinal study of the assessment by MRI and diffusion- weighted imaging of tumor response in patients with locally advanced breast cancer undergoing neoadjuvant chemotherapy. NMR Biomed 2009;22:104–13. 26. Sardanelli F, Boetes C, Borisch B, Decker T, federico M, Gil- bert FJ. Magnetic resonance imaging of the breast: recommendations from the EUSOMA working group. Eur J Cancer 2010;46:1296– 316. 27. Kauppinen RA. Monitoring cytotoxic tumour treatment response by diffusion magnetic resonance imaging and proton spec- troscopy. NMR Biomed 2002;15:6–17. 28. Bortner CD, Cidlowski JA. A necessary role for cell shrink- age in apoptosis. Biochem Pharmacol 1998;56:1549–59. 29. Carano RA, Ross AL, Ross J, et al. Quantification of tumor tissue populations by multispectral analysis. Magn Reson Med 2004;51:542–51. 30. Hakumaki JM, Poptani H, Puumalainen AM, et al. Quanti- tative 1H nuclear magnetic resonance diffusion spectroscopy of BT4C rat glioma during thymidine kinase-mediated gene therapy in vivo: identification of apoptotic response. Cancer Res 1998;58:3791–9. 31. Valonen PK, Lehtimaki KK, Vaisanen TH, et al. Water dif- fusion in a rat glioma during ganciclovir-thymidine kinase gene ther- apy-induced programmed cell death in vivo: correlation with cell density. J Magn Reson Imaging 2004;19:389–96. 32. Zhao F, Kuroiwa T, Miyasaka N, et al. Ultrastructural and MRI study of the substantia nigra evolving exofocal post-ischemic neuronal death in the rat. Neuropathology 2002;22:91–105. 33. Mandard AM, Dalibard F, Mandard JC, et al. Pathologic assessment of tumor regression after preoperative chemoradiothera- py of esophageal carcinoma. Clinicopathologic correlations. Cancer 1994;73:2680–6. 34. Woodhams R, Matsunaga K, Kan S, et al. ADC mapping of benign and malignant breast tumors. Magn Reson Med Sci 2005;4:35–42. 35. Marini C, Iacconi C, Giannelli M, Cilotti A, Moretti M, Bartolozzi C. Quantitative diffusion-weighted MR imaging in the differential diagnosis of breast leison. Eur Radiol 2007;17:2646–55. 36. Guo Y, Cai YQ, Cai ZL, et al. Differentiation of clinically benign and malignant breast lesions using diffusion-weighted imag- ing. J Magn Reson Imaging 2002;16:172–8. 37. Kuroki Y, Nasu K, Kuroki S, et al. Diffusion-weighted imag- ing of breast cancer with the sensitivity encoding technique: analysis of the apparent diffusion coefficient value. Magn Reson Med Sci 2004;3:79–85. 38. Eisenhauer EA, Therasse P, Bogaerts J, et al. New response evaluation criteria in solid tumors: revised RECIST guideline (ver- sion 1.1). EJC 2009;45:228–47. 39. Woodhams R, Kakita S, Hata H, et al. Identification of residual breast carcinoma following neoadjuvant chemotherapy: dif- fusion-weighted imaging – comparison with contrast-enhanced MR Imaging and pathologic findings. Radiology 2010;254:357–66. 40. Mandard edal. Pathologic assessment of tumor regression after preoperative chemotherapy of esophageal carcinoma. Clinico- pathologic correlation. Cancer 1994;73:2680–6. 41. Hanley JA, McNeil BJ. The meaning and use of the area under a receiver operating characteristic (ROC) curve. Radiology 1982;143:26–36. 42. Evelhoch JL, Gillies RJ, Karczmar GS, et al. Applications of magnetic resonance in model systems: cancer therapeutics. Neopla- sia 2000;2:152–65. 43. Galons JP, Morse DL, Jennings DR, Gillies RJ. Diffusion- weighted MRI and response to anti-cancer therapies. Isr J Chem 2003;4:91–101. 44. Gillies RJ, Bhujwalla ZM, Evelhoch J, et al. Applications of magnetic resonance in model systems: tumor biology and physiol- ogy. Neoplasia 2000;2:139–51. 45. Moffat BA, Hall DE, Stojanovska J, et al. Diffusion imaging for evaluation of tumor therapies in preclinical animal models. Magn Reson Mater Phys Biol Med 2004;17:249–59. 46. Paran Y, Bendel P, Margalit R, Degani H. Water diffusion in the different microenvironments of breast cancer. NMR Biomed 2004;17:170–80. 47. Pickles MD, Lowry M, Manton DJ, Gibbs P, Turnbull LW. Role of dynamic contrast enhanced MRI in monitoring early response of locally advanced breast cancer to neoadjuvant chemo- therapy. Breast Cancer Res Treat 2005;91:1–10. 48. Theilmann RJ, Borders R, Trouard TP, et al. Changes in water mobility measured by diffusion MRI predict response of meta- static breast cancer to chemotherapy. Neoplasia 2004;6:831–7. DWI and Response to Neoadjuvant Chemotherapy • 619