
Recommended
Recommended
More Related Content
Similar to Biomimetic approach in the design of transport networks at city level. Case study: Brussels-Capital Region.
Similar to Biomimetic approach in the design of transport networks at city level. Case study: Brussels-Capital Region. (20)
Recently uploaded
Recently uploaded (20)
Biomimetic approach in the design of transport networks at city level. Case study: Brussels-Capital Region.
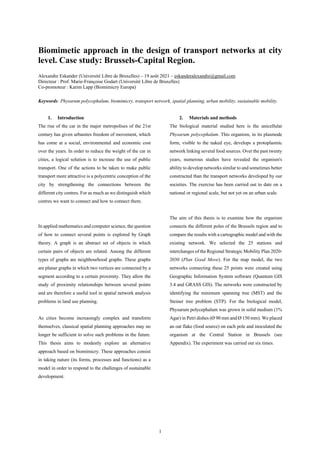
- 1. 1 Biomimetic approach in the design of transport networks at city level. Case study: Brussels-Capital Region. Alexandre Eskander (Université Libre de Bruxelles) – 19 août 2021 – eskanderalexandre@gmail.com Directeur : Prof. Marie-Françoise Godart (Université Libre de Bruxelles) Co-promoteur : Karim Lapp (Biomimicry Europa) Keywords: Physarum polycephalum, biomimicry, transport network, spatial planning, urban mobility, sustainable mobility. 1. Introduction The rise of the car in the major metropolises of the 21st century has given urbanites freedom of movement, which has come at a social, environmental and economic cost over the years. In order to reduce the weight of the car in cities, a logical solution is to increase the use of public transport. One of the actions to be taken to make public transport more attractive is a polycentric conception of the city by strengthening the connections between the different city centres. For as much as we distinguish which centres we want to connect and how to connect them. In applied mathematics and computer science, the question of how to connect several points is explored by Graph theory. A graph is an abstract set of objects in which certain pairs of objects are related. Among the different types of graphs are neighbourhood graphs. These graphs are planar graphs in which two vertices are connected by a segment according to a certain proximity. They allow the study of proximity relationships between several points and are therefore a useful tool in spatial network analysis problems in land use planning. As cities become increasingly complex and transform themselves, classical spatial planning approaches may no longer be sufficient to solve such problems in the future. This thesis aims to modestly explore an alternative approach based on biomimicry. These approaches consist in taking nature (its forms, processes and functions) as a model in order to respond to the challenges of sustainable development. 2. Materials and methods The biological material studied here is the unicellular Physarum polycephalum. This organism, in its plasmode form, visible to the naked eye, develops a protoplasmic network linking several food sources. Over the past twenty years, numerous studies have revealed the organism's ability to develop networks similar to and sometimes better constructed than the transport networks developed by our societies. The exercise has been carried out to date on a national or regional scale, but not yet on an urban scale. The aim of this thesis is to examine how the organism connects the different poles of the Brussels region and to compare the results with a cartographic model and with the existing network. We selected the 25 stations and interchanges of the Regional Strategic Mobility Plan 2020- 2030 (Plan Good Move). For the map model, the two networks connecting these 25 points were created using Geographic Information System software (Quantum GIS 3.4 and GRASS GIS). The networks were constructed by identifying the minimum spanning tree (MST) and the Steiner tree problem (STP). For the biological model, Physarum polycephalum was grown in solid medium (1% Agar) in Petri dishes (Ø 90 mm and Ø 150 mm). We placed an oat flake (food source) on each pole and inoculated the organism at the Central Station in Brussels (see Appendix). The experiment was carried out six times.
- 2. 2 3. Results and discussion From a mathematical point of view, we did not obtain any spanning tree (network connecting all the vertices) contrary to the results obtained in the scientific literature. However, structures similar to cartographic models (minimum spanning tree) were observed, confirming the capacity of the organism to elaborate a network at a lower cost. Figure 1 : Similarity between the protoplasmic network and the network created by GRASS. The organism has also constructed new nodes that are similar to Steiner points and allow it to build a better solution to the problem. Figure 3 compares the route proposed by the organism to get from Ceria to Albert with the route proposed by the STIB transport network. The comparative analysis with the existing network confirmed some known characteristics of the Brussels transport network, such as the difficulties in connecting with the south of Uccle, the difficulties between the east and the west of the canal and the potential role of the Flemish Region. Figure 2 : Situation of experiment 1b after 72 hours. Figure 3 : Comparison of the path between Ceria and Albert with the protoplasmic network and with the Brussels public transport network (Illustration on the left from Google on 7 August 2021). To monitor the development of the protoplasmic lattice, one of the six experiments was photographed every 600 seconds (10 minutes) in order to perform a time-lapse. The result is available at the following link: https://www.youtube.com/watch?v=T868l0cwaKU&t=1s 4. Limitations, perspectives and conclusion We note several limitations that make the interpretation of these results fragile. Firstly, despite the accessibility and simplicity of culturing the organism, the experimental conditions (outside the laboratory) did not prevent the appearance of moulds after more than 72 hours. Secondly, the origin of the strain of biological material does have an impact in terms of the behaviour of the network construction. This suggests the interest and necessity of involving different expertise when trying to solve such a problem under a biomimetic approach. Thirdly, we interpreted the results from a comparative perspective. Results based on more objective criteria (cost of the network, level of resilience, etc.) would be recommended to confirm or not the interest of developing such an approach in spatial planning. Nevertheless, the results obtained reinforce the idea that the natural world is full of sustainable inspiration in many areas, including urban mobility. Background This summary follows the submission of the final thesis for the academic degree of Master in Environmental Sciences and Management at the Université libre de Bruxelles (ULB). The date of the defence will be Tuesday 31 August 2021 at 3 pm. Isolation of the“Gare de Moensberg”(Comm une d’Uccle) New nodes (Steiner point) Connection from Bordet to Commuauité via the Flemish Region Ceria (nouveau noeud) Veeweyde Veeweyde Parc des étangs (nouveau noeud) Parc des étangs Albert Gare du Midi
- 3. 3 Bibliographic reference Adamatzky, A. (2008), Growing spanning trees in plasmodium machines. In : Kybernetes. 2008. Vol. 37, n° 2, pp. 258-264. DOI 10.1108/03684920810851168. Benyus J. (1997), Biomimicry: Innovation Inspired by Nature, New York: HarperCollins Publishers Inc, 320 p. Bruxelles Mobilité (2021), Le Plan régional de mobilité 2020- 2030, Plan stratégique et opérationnel, p. 290. Récupéré de https://mobilite- mobiliteit.brussels/sites/default/files/plan_goodmove.pdf Çalişkan M. et Anbaroğlu B. (2020), SoftwareX Geo-MST : A geographical minimum spanning tree plugin for QGIS. In : SoftwareX, Vol. 12, pp. 100553. DOI 10.1016/j.softx.2020.100553. Caloz R., et Collet, C. (2011), Analyse spatiale de l’information géographique, Lausanne : Presses polytechniques et universitaires romandes, 381 p. ISBN :978-2-88074-902- 6. Glaus, M., Maiorano, M. et Hausler, R., (2012), Conception des réseaux par biomimétisme : application au transport des déchets. In : Déchets, sciences et techniques. 2012. n° 62, pp. 16-21. DOI 10.4267/dechets-sciences- techniques.2530. GRASS (2021), v.net.steiner - Creates Steiner tree for the network and given terminals. Récupéré de https://grass.osgeo.org/grass79/manuals/v.net.steiner.html Lebrun K., Hubert M., Dobruszkes F. et Huynen P. (2012), L’offre de transport à Bruxelles, Cahiers de l’Observatoire de la mobilité de la Région de Bruxelles-Capitale, Cahier n°1, récupéré de https://mobilite- mobiliteit.brussels/sites/default/files/cahiers-observatoire- mobilite_loffre_de_transports_a_bruxelles.pdf Mathieson L., et Moscato P. (2019), An Introduction to Proximity Graphs. In: Moscato P., de Vries N. (eds) Business and Consumer Analytics: New Ideas. Springer, Cham. https://doi.org/10.1007/978-3-030-06222-4_4 Nakagaki, T., Yamada, H. et Tòth, Á. (2000), Maze-solving by an amoeboid organism. In Nature, 407(6803), 470. DOI 10.1038/35035159. Nakagaki, T., Yamada, H. et Hara, M. (2004), Smart network solutions in an amoeboid organism. In : Biophysical Chemistry. Vol. 107, n° 1, pp. 1-5. DOI 10.1016/S0301- 4622(03)00189-3. Price, W.L. (1974), Introduction aux graphes et aux réseaux. Traduction française par H. Grunspan. Paris : Masson et Cie, 116 p. Tero A., Takagi S., Saigusa T., Ito K., Bebber D.P., Fricker M.D., Yumiki K., Kobayashi R. et Nakagaki T., (2010), Rules for Biologically Inspired Adaptive Network Design. In : Science, Vol. 327, n° 5964, pp. 439 DOI 10.1126/science.1177894. Appendix: The 25 stations and interchanges of the Regional Strategic Mobility Plan 2020-2030 (Good Move Plan) Illustration : Inoculation du Physarum polycephalum au point 1 (Gare Centrale).
- 4. 4 The 25 stations and interchanges in the Brussels-Capital Region's Strategic Regional Mobility Plan (Plan Good Move) include 7 national stations, 12 poles to be strengthened and 6 transfer nodes to be created: - The national stations : (1) Gare Centrale (2) Bruxelles-Nord (3) Schuman (4) Bruxelles-Luxembourg (5) Gare de Schaerbeek (6) Bruxelles-Midi (7) Gare d’Etterbeek - The poles to be strengthened: (8) Erasme (9) Albert (10) Herrmann-Debroux (11) Merode (12) Montgomery (13) Meiser (14) Roodebeek (15) Bordet (16) Gare de l’Ouest (17) Simonis (18) Basilique (19) Heysel - And the transfer nodes to be created : (20) Veeweyde (21) Moensberg (22) Communauté (23) Verboekhoeven (24) Heembeek (25) Gare de Jette