Calculation of plant nutrients in relation to N.pptx
•Download as PPTX, PDF•
0 likes•1 view

nutrient

Recommended
Recommended
More Related Content
Recently uploaded
Recently uploaded (20)
Featured
Featured (20)
Calculation of plant nutrients in relation to N.pptx
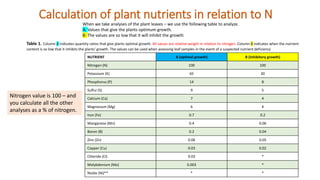
- 1. NUTRIENT A (optimal growth) B (inhibitory growth) Nitrogen (N) 100 100 Potassium (K) 65 30 Phosphorus (P) 14 8 Sulfur (S) 9 5 Calcium (Ca) 7 4 Magnesium (Mg) 6 4 Iron (Fe) 0.7 0.2 Manganese (Mn) 0.4 0.06 Boron (B) 0.2 0.04 Zinc (Zn) 0.06 0.05 Copper (Cu) 0.03 0.02 Chloride (Cl) 0.03 * Molybdenium (Mo) 0.003 * Nickle (Ni)** * * Table 1. Column A indicates quantity ratios that give plants optimal growth. All values are relative weight in relation to nitrogen. Column B indicates when the nutrient content is so low that it inhibits the plants' growth. The values can be used when assessing leaf samples in the event of a suspected nutrient deficiency Calculation of plant nutrients in relation to N When we take analyses of the plant leaves – we use the following table to analyze. A: Values that give the plants optimum growth. B: The values are so low that it will inhibit the growth Nitrogen value is 100 – and you calculate all the other analyses as a % of nitrogen.
- 2. Low content High content You can see an example how it is used on a typical sample. You use the analyze data as following: Nitrogen value is 100 – and you calculate all the other analyses as a % of nitrogen. Remember to use the same value for all figures (mg/kg TS or similar)